Here at Dark Cubed, we are focused on a new approach to cyber security that works for companies of all sizes. A key part of our mission is to use elegant engineering to simplify the deployment and use of sophisticated security capabilities. One key component behind Dark Cubed is our ability to provide enhanced protection for our customers through near real-time data analytics and predictive algorithms. As we continue to deploy Dark Cubed to more customers, we are ramping out our data science and analytics capabilities, both in-house and through partnerships. Two of the partnerships we are excited about are with the University of New Haven (focusing on IoT and Mobile Malware applications, www.unhcfreg.com) and George Mason University (focusing on data analytics and visualization, https://ece.gmu.edu).
Needless to say, we are very excited to be working with such awesome folks at these educational institutions!
Why the Dark Cubed approach is different
One of the key functionalities of Dark Cubed is the ability for our customers to monitor traffic on their networks in a way that is prioritized against threat. How these threat scores are calculated, and the benefit to our customers, is what makes the Dark Cubed approach truly unique.
At the most basic level, we score the risk of that traffic using what we call a three legged stool algorithm. First we look at the world of known threats. This world has to do with massive amounts of threat intelligence, block lists, and other insights into malicious infrastructure that we have been collecting for well over a year. Second, we are able to be predictive about new threats using statistical analysis against the known threat data set we have collected to determine if certain traffic may be malicious even if it has not been identified before. Finally, we look at a real-time data set of anonymous data from our community of users to determine interesting trends and patterns in the threats to those networks.
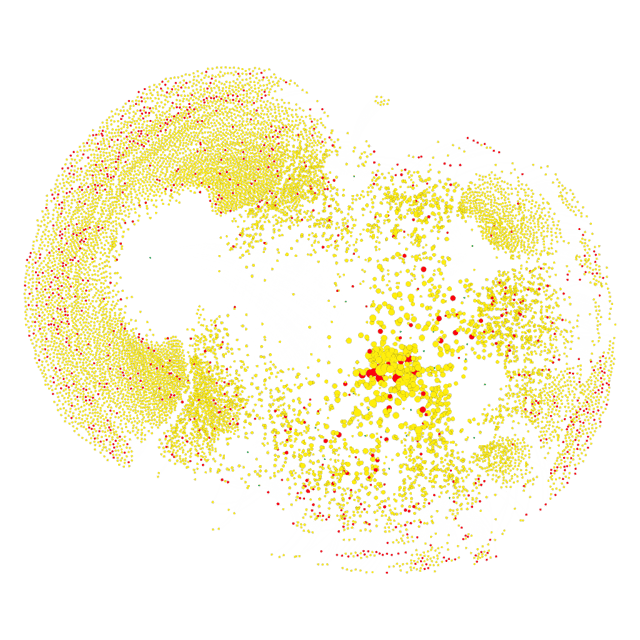
While the benefit in the first two processes is significant (and would cost significant amounts of time and money for each of our customers to build out individually), it's this third area that excites us the most. The power behind Dark Cubed is the ability to use data analytics to observe threats to our customers in real time, while allowing our customers complete privacy through anonymity. To give you a peak into what this looks like, check out the network graph below produced from the Dark Cubed data set:
 This graph visualizes over 20K of the highest threats observed within the Dark Cubed data set across 44 different customer deployments over the last year. At the center of the groupings are green dots that represent anonymous Dark Cubed customers. These customers are then connected to the threats that have been targeting their networks. The red circles indicate the highest threats, while the yellow are the next highest. Finally, the size of the dot corresponds to the number of unique networks that saw each malicious IP address or Domain… so, the bigger the colored dot, the more networks it targeted.
The more commonly seen items are grouped to the middle of the graph, while the more unique items are pushed to the edge. Using these forms of graph analysis, Dark Cubed analysts can perform advanced analytics to identify new and emerging threats to help our customers protect what matters most.
While this is very, very cool, what does it mean to our customers?
It means that our customers are protected by cutting edge data analytics that rival what even the largest of enterprises can deliver. By realizing the power of community and real-time analytics, we are finally able to envision a future where defense can start to move at the speed of attack!
As you can tell, we are really geeking out on this stuff and are so excited to be able to share with a community of people like you that are excited about finally doing something new in cyber security! We are working on several new blog postings for the coming weeks with more detailed data analysis, so please stand by!


![[Download eBook] Why the Cyber Security Market is Broken](https://no-cache.hubspot.com/cta/default/2571443/25d16aa0-85c2-4547-ac43-d0c5a9cc59e1.png)

